|
Techniques for Documenting with Proof or Supporting Evidence, and Related Strategies for Problem Solving By David Alderoty © 2016
Chapter 22) Technique-21, Evidence Based on Surveys, And Related Concepts and Strategies
This e-book presents 28 techniques for supporting the validity of the statements you write. Left click on the above for a list of the techniques
This chapter contains a little over 4,500 words
If you want to go to chapter 21, left click on the following link:
www.TechForText.com/DP/chapter-21
To contact the author use David@TechForText.com or left click for a website communication form
Table of Contents, and an Outline of this Chapter The following is a hyperlink table of contents, as well as an outline of this chapter. If you left click on a blue underlined heading, the corresponding topic or subtopic will appear on your computer screen. Alternatively, you can scroll down to access the material listed in the table of contents, because this chapter is on one long webpage.
Topic 1.) Technique-21. Evidence Based on Surveys Subtopic, A Survey is one of the Techniques, Commonly Used to Obtain Scientific Information Subtopic, A Simplified Description of Some of the Techniques Used For Surveys Of People Subtopic, List of Problems, Goals, and Situations Where Surveys Might Be Useful Topic 2.) Gathering and Using Survey Information for Your Writing Project Subtopic, Search Pages from Google and Bing Subtopic Using Web-Based Services and Tools to Create Your Own Online Surveys Subtopic, Hiring a Company to Carry Out a Truly Scientific Survey Subtopic, Describing Your Survey, or Crediting the Source of a Survey Topic 3.) Surveys: Definitions, Descriptions, and Related Mathematics Subtopic, A Definition of a Survey, As a Three-Step Technique Additional and Supporting Information for This chapter, from Web-Based Articles Additional and Supporting Information for This Chapter, from Web-Based Videos
This E-Book Provides Additional and Supporting Information from other Authors, with Web Links
This e-book contains links to web-based articles and videos from other authors, for additional, alternative, and supporting information. The links are the blue underlined words, presented throughout this e-book. However, some of these links are to access different sections of this e-book, or material on my own websites. Quotes and paraphrases in this e-book have hyperlinks to access the original source. The quotes are presented in brown text, which is the same color of these words. (The precise text color is RGB Decimal 165, 42, 42, or Hex #a52a2a) Some of the web links in this e-book will probably fail eventually, because websites may be removed from the web, or placed on a new URL. If a link fails, use the blue underlined words as a search phrase, with www.Google.com If the link is for a video, use www.google.com/videohp The search will usually bring up the original website, or one or more good alternatives.
|
|
For those who prefer listening, as an alternative to reading, this book is recorded in an audio format.
For an audio narration of topic 1, left click on these words (requires 7 minutes, and 12 seconds).
For an audio narration of topic 2, left click on these words (requires 19 minutes, and 37 seconds).
Topic 3 contains mathematical expressions that cannot be verbalized in a way that is easily comprehended. Thus, it is not recorded.
|
|
Topic 1.) Technique-21. Evidence Based on Surveys ||| Technique-21 consists of using information from surveys as supporting evidence for claims and statements in a document, and for dealing with certain types of problems and goals. Survey information is likely to be useful for writing projects, problems, and goals that involve the social sciences, business, and marketing. However, certain types of surveys are useful for the biological and physical sciences. This will become apparent after you read the following subtopic.
Subtopic, A Survey is one of the Techniques, Commonly Used to Obtain Scientific Information ||| Surveys, experimentation, and field observations are three methods of obtaining scientific information. There are many types of surveys, and they are not only used to obtain information about people. Surveys are also used to obtain data about animals, plants, and inanimate objects. This will become apparent if you examine the following web-based articles: · Animals and plants Surveys, monitoring and records
· Conducting and Analyzing Biodiversity Surveys
· Conducting Wildlife Surveys Conducting Wildlife Surveys
· Different Methods of Geophysical Surveys Used in Mineral Prospecting
· Geomagnetic surveys of impact structures and meteorite craters
When we hear the word surveys, many of us think of a questionnaire that is filled out by the participants or interviewers. Keep in mind that there are different types of surveys, and many different ways of collecting data. However, all surveys involved various types of statistical evaluations.
Subtopic, A Simplified Description of Some of the Techniques Used For Surveys Of People ||| Surveys that involve people can be very complex, but the basic idea is relatively simple. Usually survey data is obtained with questionnaires, which may be filled out by the participants, or by people that interview the participants. Scientific surveys require the same set of questions for each participant that is interviewed. A simplified description of a survey that involves people is presented below using an example. Let us assume a town has a population of 10,000 adults. A marketing firm wants to carry out a survey in the town. However, because of financial limitations the marketing firm will only interview 100 adults. This is 1% of the adult population. Let us assume the survey results indicate that from the 100 people interviewed, 20 wanted to buy skiing equipment, 30 wanted to buy fishing equipment, and 50 had no interest in purchasing skiing or fishing equipment. These results can be converted to a percentage, and apply to the entire adult population of the town, as follows:.
· 20% want to buy skiing equipment This is 20% of 10,000, which equals 2000 people.
· 30% want to buy fishing equipment This is 30% of 10,000, which equals 3000 people
· 50% do not want to buy skiing or fishing equipment This is 50% of 10,000, which is equal to 5000 people.
Subtopic, List of Problems, Goals, and Situations Where Surveys Might Be Useful ||| Surveys of people are widely used, for many types of problems and goals. This includes marketing, political campaigns, public opinion concerning pending legislation. Surveys are also used to evaluate forests, farmland, and to find fossil fuels and minerals. Listed below, there are few examples that illustrate the utility of surveys.
● Surveys are useful for estimating the level of support for a political candidate. This is useful for the candidate, because if provides feedback on how well he or she is carrying out the political campaign. Survey information is also useful for making the decision to quit the campaign, if results are inadequate, or to continue with it if results are good.
● Surveys can be used to estimate the number of people that support legislation for a new law. If survey results indicate disapproval of the law, it can be modified to increase its popularity.
● Surveys can be used to evaluate the need for a public works project Surveys of this nature may include public opinion, but they may also include surveys that involve the need for the public works project. For example, building a new highway might be, partly or totally based on surveys that indicate the level of traffic congestion. Surveys of this nature can be carried out with electronic devices that count the number of automobiles on the road, at various time intervals, throughout the day and night.
● Surveys can be used to evaluate the feasibility of opening a business in a specific neighborhood. This can involve surveys that evaluate the population of the neighborhood and surrounding area, to see if the people will need the products or services provided by the new business. This can also involve surveys that count the number of potential competitors that the business will have if it opens in a specific locality.
● Surveys can be used to estimate the number of people in a population that are poor, low income, middle-income upper-income, and wealthy. This information can be used to estimate tax revenue, and estimate the cost of public welfare programs.
● Surveys can be used to evaluate the spread of a disease This information sometimes can be used to reduce the risk of an epidemic, if the survey indicates where, and how a diseases spreading. This can involve travel warnings based on survey information, and directing medical services to localities that appear to be the source of the disease.
● Geological surveys can be used to find mineral and fossil fuel deposits The results of surveys of this nature can indicate if investment should be made in a specific locality for mining were drilling efforts.
Surveys of trees in a specific forest, can indicate the number of healthy and unhealthy trees, and the effect of pollution on the trees The survey results might indicate the need for additional studies and/or corrective action, to maintain a forest.
|
|
Topic 2.) Gathering and Using Survey Information for Your Writing Project ||| In this topic, I discuss a number of ways of obtaining survey information for your writing projects, problems, and goals. The simplest way is to use published sources that contain the survey information you need. Published survey data can be obtained with the specialized search engines, search pages, and websites presented in this topic. When using public survey information, you must credit the source, which can be achieved with conventional citation styles, such as MLA or APA. Another alternative is to create your own online surveys. There are websites that provide online tools that are designed for this purpose. However, it may not be feasible to carry out a truly scientific survey in this way. This is because it may be difficult to obtain an adequate representative sample of the population that is required for a truly scientific survey. Devising a scientific survey from scratch is one alternative, and another is to hire a company that specializes in carrying out surveys. Both of these alternatives can be expensive. However, if you are working for a large company or government agency that needs survey information, both of the alternatives might be feasible. In the following subtopics, there are additional details to help you use the ideas presented above. This is coupled with other information, and online resources for obtaining survey data. This also includes online resources for creating your own surveys.
||| This subtopic, provide three search engines, and related websites, from the United States Census Bureau, from U.S. Geological Survey, and from the Centers for Disease Control and Prevention. The search engines from these agencies are useful for finding web-based survey data, and other information. However, they are not designed for conventional web searches.
The United States Census Bureau carries out a large-scale survey to count the population of the United States every 10 years. However, they carry out many other surveys. The United States Census Bureau has a specialized search engine on its homepage at www.census.gov This search engine is useful for obtaining survey information, and other data. You can use this engine by going to www.census.gov, or by clicking on one of the following links:
Some examples of search pages from the United States Census Bureau’s search engine are presented below. These search pages provide a great deal of useful information.
· Surveys
The following quote is from the U.S. Geological Survey: www.usa.gov/federal-agencies/u-s-geological-survey “The U.S. Geological Survey is the nation's largest water, earth, and biological science and civilian mapping agency. It collects, monitors, analyzes, and provides scientific understanding of natural resource conditions, issues, and problems.” U.S. Geological Survey has a search engine on its homepage at www.usgs.gov Some examples of very useful search pages that I obtained with this search engine are presented below:
· “Techniques of surveying from satellites”
The Centers for Disease Control and Prevention has a search engine on its homepage at www.cdc.gov The following are examples of results obtained with this search engine:
● Vaccinations surveys and studies
● Surveys on life-threatening viruses
● Surveys on the risks of surgery
● Surveys on the benefits of surgery
See also USA.gov is your online guide to government information and services. This website has a search engine for finding any type of government information, at www.usa.gov
Subtopic, Search Pages from Google and Bing ||| In this subtopic, there is a list of potentially useful search pages involving various types of surveys. The search pages are from Google and Bing. Some of the results on these search pages might not involve surveys, but almost all of the results appear to be potential useful for a writing project. The list also contains a few websites that were obtained from the Google, and Bing, search pages. You may prefer to carry out your own searches. This can result in information that is more precisely focused on your needs. To carry out your own searches, for survey information create phrases similar to the ones shown below. Note the underlined letters and words in red bold type, should be replaced with search phrases that are relevant to your objective.
· Surveys on X
· Surveys that deal with locality XYZ
· Surveys on X, in locality XYZ
· Surveys and studies on X
· Surveys and experiments on X
The following are search pages from Google and Bing This list includes a few websites that were obtained from the search pages.
● Google search pages: Surveys on traffic accidents
● Website from Google search: “Traffic and Traffic Accidents in Ankara Survey”
● Website from Google search: “Accident Surveys | Point to Point Surveyors”
● Bing search pages: Surveys on traffic accidents
● Websites from Bing search “traffic accident Survey ”
● Website from Bing search “NCDOT: Traffic Surveys ”
● Google search pages: “Marketing surveys”
● Bing search pages: “Marketing surveys”
● Google search pages: Population surveys, by country
● Bing search pages: Population surveys, by country
● Website from Bing search: “Current Population Survey (CPS) - Census”
● Google search pages: "Longevity surveys”
● Bing search pages: "Longevity surveys”
● Google search pages: “Longevity surveys” by country
● Bing search pages: “Longevity surveys” by country
● Google search pages: “Surveys on happiness”
● Bing search pages: “Surveys on happiness”
● Website: “Happiness Survey” from Bing search
● Google search pages: “Surveys on life satisfaction”
● Bing search pages: “Surveys on life satisfaction”
● Google search pages: “Scientific surveys” on the benefits of supplements
● Bing search pages: “Scientific surveys” on the benefits of supplements
● Website from Bing search: Life Satisfaction, by Arie Kapteyn
● Website from Bing search: “Coenzyme Q10 Evidence - Mayo Clinic”
● Google search pages: The "frequency of war" by country"
● Bing search pages: The frequency of war by country
● Website from Bing search: The Frequency of Wars, by Mark Harrison
● Google search pages: Surveys and studies on global warming
● Bing search pages: Surveys and studies on global warming
● Google search pages: Surveys on fossil fuels reserves
● Websites from Google search: “National Oil and Gas Assessment”
● Bing search pages: Surveys on fossil fuels reserves
● Google search pages: Surveys on trees
● Bing search pages: Surveys on trees
● Website from Bing search: “Tree Survey”
Subtopic Using Web-Based Services and Tools to Create Your Own Online Surveys ||| Listed below are a number of web-based articles and videos that provide instructions, and resources to create your own online surveys. This can involve the creation of survey forms for your own website, or survey forms that are hosted on other websites. However, online surveys of this nature may have limited utility. You are unlikely to obtain an adequate cross section of the general population, to carry out a truly scientific survey. Nevertheless, these online survey resources are excellent if you want to obtain feedback from your readers, your classmates, your students, your customers, or your friends and acquaintances.
Web-based Videos for creating online surveys
· YouTube search pages: Creating online surveys
· How to create an online Survey using Excel and Microsoft Office Online, by Scott Hanselman
· Google Forms (Online Survey) Tool by Rob Bowe
· Create a free online survey using Survey Monkey, by Chris Olson
· How To Create A Free Online Survey
· Creating Online Surveys-And Why They Matter
· How to Create a Free Online Survey with Google Docs
· Google Form : How to create a Google Forms (Online Survey) With Google Drive, by Kabeer Khan
· CREATING AN ONLINE SURVEY/QUESTIONNAIRE IN SURVEY MONKEY, by Jamie Edmondson
· Creating a survey on Bristol Online Survey
· How to Create a Survey With Excel Online
· Building an Online Survey | Part 1 - Sketching Out the Database
Web-based articles for creating online surveys:
· Google search pages: “Creating online surveys”
· Bing search pages: “Creating online surveys”
· Create a Free Online Survey Using Google Docs, by Erica Douglass
· Web-based articles creating online surveys · Conducting Online Market Research: Tips and Tools
· Create better surveys and get answers
· Create and send surveys, SurveyMonkey
· Create an online survey in 4 easy steps Doodle
· Live Audience Participation Poll Everywhere lets you engage your audience or class in real time
· Create online surveys with ease
· SoGoSurvey - Online Survey Tool
· 10 top online survey tools for your nonprofit
Subtopic, Hiring a Company to Carry Out a Truly Scientific Survey ||| If you need a truly scientific survey, involving a cross-section of a population, the best strategy might be to hire a company specializing in carrying out surveys. Keep in mind that a truly scientific survey requires complex mathematics. It might also require skilled interviewers, and questionnaires created by experts. This can involve many trained individuals. Thus, projects of this nature are likely to be expensive. However, it should be feasible and probably cost-effective, if you are working for a large company or government agency that needs accurate survey data. Listed below there are five companies that can carry out surveys:
· Quester A Consumer Intelligence Company Harnessing the Power of Conversation
· Propeller Insights A full-service market research company
· Amplitude Research, Inc. Survey Company
· The Next Generation of Polling: Conduct Statistically Valid Polls Randomization
Subtopic, Describing Your Survey, or Crediting the Source of a Survey ||| If you use published sources to obtain survey information, you can use a conventional citation style to credit your source. See How to Cite a Survey in MLA Format by Nadine Smith, and How to Cite a Survey in APA by Petra Wakefiel If you created your own survey, you should indicate that you did so, in the document you are writing. You should ideally include all relevant information about your survey, such as how you carried out your survey. You should explain how you selected the sample population, and the procedures and mathematics, you used for your survey. The above is important, because it indicates the relative degree of validity of the survey.
|
|
Topic 3.) Surveys: Definitions, Descriptions, and Related Mathematics ||| This topic provides two definitions of a survey. These definitions are worded differently, and each will provide a unique insight on the concept of a survey. However, the definitions are describing the same technique, from different perspectives. The first definition is relatively simple, and the second definition is more technical. The descriptions in this topic involve mathematics, which is simplified. The formulas are intuitive, and most of them involve simple calculations. This topic shows a small portion of the mathematics that can be useful for evaluating survey data. If you are interested in a detailed discussion, or course in the mathematics involved with surveys, or in statistics, see the web-based articles and videos at the end of this topic.
|||
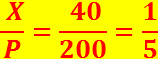
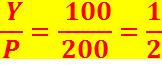
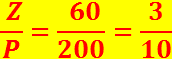
The following definition is based on the way I am using the terminology, and it applies to people, animals, plants, and inanimate objects. A survey is a technique for obtaining answers to statistical questions, involving a number of entities that comprise a population, a group, or a set. Thus, a survey can be used to answer the following five general questions. The answers to these questions are presented in symbols, which are essentially formulas. To obtain answers in a number format, with the following five questions, let us assume that there are 40 X’s, 100 Y’s and 60 Z’s in set P. This can be represented by X=40, Y=100, and Z=60. Set P is the sample population of entities, which can be thought of as the people participating in a survey. Note, the answers to the following five questions, are presented in red text that is highlighted in yellow.
Question 1) How many X’s, Y’s and Z’s are there in set P Set P is the sample population, which can be represented as X+Y+Z. The answer is 40+100 + 60=200 Thus there are 200 people participating in the survey. This can be represented as set P, which has 200 entities.
Question 2) What is the ratio of the number of X’s, Y’s and Z’s in this population? The answer is X:Y:Z which is 40:100:60 This ratio can be simplified to 2:5:3
Question 3)
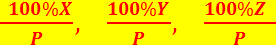
What is the percentage of X’s, Y’s and Z’s in this population? The answer is
Question 4) What portion
of the population is comprised of X’s, Y’s, and Z’s. This
involves representing X, Y, and Z, in terms of a fraction of the population.
The answer in symbolic form is
Question 5) What is the ratio of the X’s, Y’s, and Z’s. This involves writing a ratio based on the quantities of the X’s, Y’s, and Z’s. The quantities was represented above as follows: X=40, Y=100, and Z=60.
The ratio can be represented by X:Y:Z. In a number format it is 40:100:60 This ratio can be simplified to 2:5:3
Presented below there are examples of specific questions that can be answered by carrying out appropriate surveys. Keep in mind that a survey is a technique for obtaining answers to statistical questions, involving a number of entities that comprise a population, a group, or a set.
· What percentage of the registered voters in the United States are Democrats, what percentage are Republicans, and what percentage are from other political parties?
· Who is ahead in the election campaign, is it candidate-X, candidate-Y or candidate-Z? Questions of this nature are usually answered in percentage.
· How many of the trees in the Amazon rainforest are healthy, and how many are unhealthy? When the numbers are obtained, they can be converted to a percent, such as X% are healthy and Y% are unhealthy.
· What percentage of the animals in Zimbabwe are Predators, and what percentage are non-predators.
· How many mountains are there in the United States that are over 5000 feet, and how many are less than 5000 feet? When the numbers are obtained, they can be displayed in percent, such as X% are over 5000 feet, and Y% are less than 5000 feet.
Subtopic, A Definition of a Survey, As a Three-Step Technique ||| NOTE: The definition presented in this subtopic is based on the way I am using the terminology, and it involves three essential steps discussed a couple of paragraphs below. If a study does not involve the three essential steps, I would not classify it as a survey. However, this is not meant to imply that surveys only have three steps. A complex scientific survey can have dozens of steps. This will become apparent after you read the definition and the three essential steps presented below: A survey is a technique for obtaining statistical information about people or other entities that comprise a specific population, group, or set, using the three steps listed below this paragraph.
Step 1) The number of entities to be surveyed are calculated, to obtain the appropriate sample population. To clarify the three steps, let us assume you are conducting a survey to determine the number of registered Democrats and Republicans in a locality called Littletown. There are 10,000 registered voters in Littletown, and they are either Democrats or Republicans. Your survey involves a representative sample of 1% of the registered voters in littletown.
To determine the number of entities to be surveyed, as indicated in step 1, multiplied the population of registered voters by 1% as follows: (1/100)(10,000)=100 people This can also be done with following formula:
Step 2) The entities that comprise the sample population are surveyed and the results are placed into categories. With the example described above, there are two categories, which are Democrats and Republicans. The number of Democrats and Republicans can be represented as follows: Democrats=D and Republicans=R
Step 3) The number of entities in each category are counted, and one or more of the following calculations are carried out:
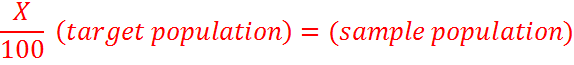
The percent of the sample population that comprises each category is calculated. When this result is obtained, it can be applied to the target population, to obtain the results of the survey. With the example, this would be calculating the percent of Democrats and Republicans in the sample population. If we know this percentage, we can apply it to the target population to obtain the results of the survey. In other words, if the Democrats was X% and the Republicans were Y% in the sample population, it would be the same in the target population. This is assuming that the sample population is a good representation of the target population.
The fraction of the sample population that comprises each category is calculated. After calculating this result, it can be applied to the target population, to obtain the results of the survey. With the example, this would involve calculating the fraction of Democrats and Republicans in the sample population. The resulting fractions can be applied to the target population to obtain the results of the survey.
A ratio can be calculated with the number of entities in each category of the sample population. This result can be applied to the target population, to determine the results of the survey. With the example, this would involve calculating the ratio of Democrats to Republicans in the sample population. This ratio can be applied to the target population to obtain the results of the survey. Another words, if the ratio of the Democrats to Republicans in the sample population is X:Y, it would be the same in the target population. This is assuming the sample population is a good representation of the target population.
Thus, there are three alternatives presented above that can be used to obtain the results of the survey. I will illustrate the three alternatives using the example of Democrats and Republicans in Littletown. To do this, let us assume that the sample population 60 Democrats, and 40 Republicans. This can be represented as Democrats=D=60, Republicans=R=40
Following formula represents the percent of the sample population that are Democrats
With the above formula, the following result is calculated
Based on the above calculations, 60% of the sample population are Democrats. Thus, we can assume that 60% of the target population, are most likely Democrats.
The following formula represents the percent of the sample population that are Republicans
With the above formula, the following result is calculated
Based on the above calculations, 40% of the sample population are Republicans. Thus, we can assume that 40% of the target population are most likely Republicans
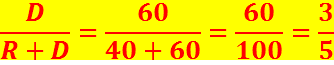
The following formula represents the fraction of the sample population that are Democrats
With the above formula, the following result is calculated
Based on the above calculations,
Thus, we can assume that
target population are most likely Democrats
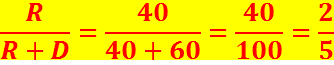
The following formula represents the fraction of the sample population that is Republican
With the above formula, the following result is calculated
Based on the above calculations,
Thus, we can assume that
target population are most likely Republicans
The ratio of Democrats to Republicans is D:R=60:40 This ratio can be simplified to 3:2
The ratio of Republicans to Democrats is R:D =40:60 This ratio can be simplified to 2:3
With algebra, it is easy to calculate the number of Democrats and Republicans in the target population. The calculated results are actually a statistical estimate, because it is unlikely that the sample population will be a perfect representation of the target population. These calculations can be carried out using three different methods, which are based on percentage, fractional relationship, or ratios of the sample population. The calculations are carried out below:
Method 1) Percentage of Sample Population Based on the calculations presented above, there are 60% Democrats and 40% Republicans in the sample population.
Let 60X represent the number of Democrats in the target population
Let 40X represent the number of Republicans in the target population
60X+40X=10,000
100X=10,000
X=100
Thus, the number of Democrats in the target population is calculated as follows: For the Democrats, 60X=60(100)= 6000
For the Republicans, 40X=40(100)=4000
Method 2) The Fractional Relationship of the Sample Population Based
on the calculations presented above, the fractional relationship is presented
by the following ratio:
Democrats=
Republicans =
X=10,000
Thus, the number of Democrats in the target population is calculated as follows:
Democrats=
The number of Republicans in the target population is calculated as follows:
Republicans=
Method 3) Using the Ratios of the Sample Population The ratio of Democrats to Republicans is 3:2, based on the sample population. The ratio of Republicans to Democrats is obviously 2:3.
The ratio of Democrats to Republicans is 3:2. This ratio can also be represented as 3X:2X. Thus, I will represent the number of Democrats and Republicans as follows:
The number of Democrats=3X
The number of Republicans=2X
3X+2X=10,000
Solving for X
5X=10,000
X=2,000
Thus, the number of Democrats in the target population is calculated as follows:
Democrats=3X=3(2,000)= 6,000
The number of Republicans in the target population is calculated as follows:
Republicans=2X=2(2,000)=4,000
There is additional and supporting information from web-based sources presented below
|