
A General Model of Simple and Complex Systems
By David Alderoty © 2015
Over 980 words
To contact the author left click for a
website communication form, or use:
To go to the previous chapter
left click on one of the following links:
For HTML
www.TechForText.com/Sm/Chapter-4
For PDF
www.TechForText.com/Sm/Chapter-4/PDF.pdf
If you want to go to the table of contents
of this chapter left click on these words
To Access Additional Information with Hyperlinks
After I complete a writing task, I select a number of websites from other authors, and link to them. The links are the blue underlined words, and they can be seen throughout this book. The in‑line links, such as the link on these words, are primarily to support the material I wrote, or to provide additional details. The links presented at the end of some of the paragraphs, subsections, and sections are primarily for websites with additional information, or alternative points of view, or to support the material I wrote. The websites contain articles, videos, and other useful material.
If a link fails, use the blue underlined words as a search phrase, with www.Google.com. If the failed link is for a video use www.google.com/videohp. The search will usually bring up the original website, or one or more good alternatives.
THE FOCUS AND PURPOSE OF THE SYSTEM PERSPECTIVE PRESENTED IN THIS E-BOOK
To prevent confusion, I am placing the following statement at the beginning of each chapter in this e-book. Keep the ideas presented in the following three paragraphs, in mind as you read this e-book.
The main utility of a systems theory, especially the General Model of Simple and Complex Systems, is to assist in the study of systems, especially in terms of problem solving, goal attainment, and observational and experimental research. From a system perspective, all the relevant factors of a system are considered to obtain an objective. This can include the behavior and overall functionality of the system, its environment, its components, its structure, and related dynamics, cause-and-effect sequences, inputs, outputs, forces, energy, rates, time, and expenditures.
Examples of a system are atoms, molecules, chemicals, machines, electronic circuits, computers, planets, stars, galaxies, bridges, tunnels, skyscrapers, forests, rivers, streams, oceans, tornadoes, hurricanes, microorganisms, plants, animals, human beings, social groups, small businesses, organizations, political parties, cultures, and the human mind of an individual, including related behaviors and personality traits.
A systems perspective is also useful for writing projects. This involves writing about all the relevant factors of a system, in terms of a thesis, or topic.
The purpose of this e-book is to discuss and explain the many details associated with the systems perspective described above. This required twelve chapters, which are relatively short.
A General Model of Simple and Complex Systems, by David Alderoty, 2015
Diagrams for Cause-and-Effect Sequences, Energy, & Information Flow of Dynamic Systems
Using Similar Diagrams for: Cause-and-Effect, Energy, & Information Flow for Dynamic System
A General Model of Simple and Complex Systems, by David Alderoty, 2015
Information, energy, and cause-and-effect sequences flow through the components of a system in similar configurations. Thus, the same type of diagram can generally be used to represent and evaluate information and energy flow, as well as the pathways of a cause-and-effect sequence. This will become clear with the diagrams presented below.
A detailed diagram of a system will usually be more complex, then some of the following examples. However, the same general type of diagram is useful when designing and building a system, when trying to identify malfunctions in a system, and when evaluating problems, and goals using a system theory.
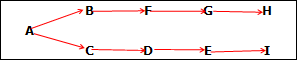
A chain reaction
Two cause-and-effect sequence,
initiated by component A
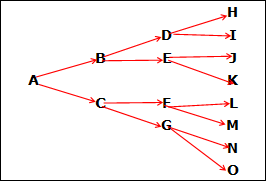
Complex cause-and-effect sequence
initiated by component A, then
reinitiated by component F
The flow of DC electric current through
eight components wired in series
This can represent a string of Christmas
lights running off a DC power source.
The flow of DC electric current through
two components wired in parallel
This can represent two light
bulbs operated with a battery.
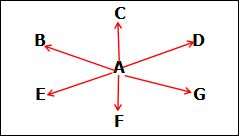
The one-way flow of information from
a central source A, to six components
This can represent a manager giving
orders to a group of employees.
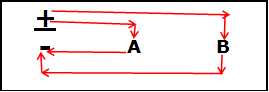
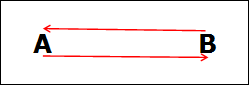
Two-way flow of information
from A to B, and B to A
This can be two people
talking to each other.
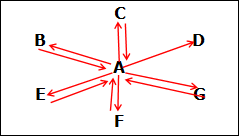
The two-way flow of information,
from A to six components
This can represent, a manager
having a conversation with
a group of employees.
Dynamic Systems: Fishbone, and Cause-and-Effect Diagrams for Problem Solving and Goal Attainment General Model of Simple and Complex Systems
Fishbone diagrams are commonly used for problem solving and goal attainment. A traditional fishbone diagram is laid out similar to the bone structure of a fish. The possible causes, or contributing factors to a problem, are listed on the skeleton. The problem is described in a few words, usually on two sides of the diagram.
The above will be clarified, if you left click on the following Google link: Google images: Fishbone diagrams. Note if you left click on any of the images on Google’s website, a larger image will be displayed. If you click on this larger image a website will open with more information.
Many diagrammatic representations for problem solving and goal attainment are more or less similar to a fishbone diagram, such as a cause-and-effect diagram. (For more information left click on this Google link: Google images: cause-and-effect diagram.) To simplify the text in this section, I am using the words fishbone diagram, for any diagram that is similar to the fishbone structure, or a diagram that provides a similar utility.
Unlike the diagrams presented in the previous subsection, fishbone diagrams are predefined in structure and layout. Thus, they cannot be used to represent the flow patterns that take place within a complex dynamic system, such as a computer, a social network, or a biological entity.
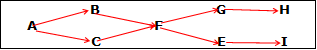
Fishbone diagrams are useful for problems that have a number of possible causes. The causes must be directly related to the problem, such as the following example: A, B, C, D, E, F and G contributes to, or causes problem X. However, fishbone diagrams are not likely to be useful when a problem involves complex cause-and-effect sequences, such as the following:
The arrows represent the word causes.
![]()
Another problem with most fishbone diagrams is the very limited space they provide for describing the problem, and its possible causes. These diagrams generally have little or no space to describe the solution. Even non-technical business problems, generally require reports that are at least several hundred words in length. I devised a solution to circumvent the limitations of the fishbone diagram, which is explained in the following subsection.
If you want more information on diagrams for problem solving see the following websites.
Dynamic Systems: a Template for Problem Solving
A General Model of Simple and Complex Systems, by David Alderoty, 2015
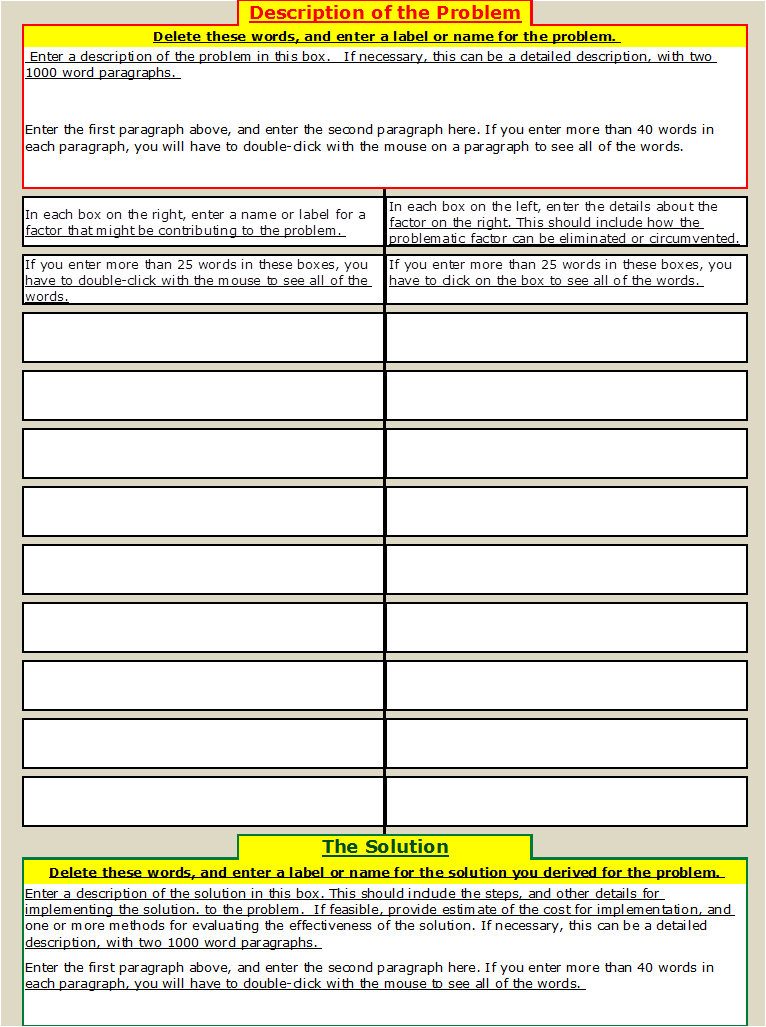
I created a structured problem-solving template, using Microsoft Excel. This template does not have the text limitations of the fishbone diagram. The problem-solving template starts with a box scribe the problem. You can put two paragraphs in this box which can be 1000 words in length. This is followed by 10 boxes on the left, for entering a name or a label for each factor that might be contributing to the problem. On the right side, there are another 10 boxes, which are for entering detailed descriptions about each factor. Each of the boxes on the left and right side can hold up to 1000 words.
The idea here is to try to eliminate or circumvent the factors listed in the boxes to obtain a solution. On the bottom of the problem-solving template, there is a box for describing the solution. This box can hold two 1000 word paragraphs.
The problem-solving template has instructions, in some of the boxes. These instructions should be deleted after they are read, because the boxes are for entering data about the problem and the solution.
The template is designed to produce a limitless number of problem-solving documents. When you left click on the problem-solving template, a new document is created, which must be saved with a new filename, before you enter data.
If you want to download a copy of the problem-solving template, in a zip folder, left click on the blue underlined words. (Alternative link: www.TechForText.com/Sm/P.Zip) If you want the problem-solving template, without zip folder, left click on the blue underlined words. When the template is downloaded without a zipped folder, you must save the template with any filename you prefer. (Alternative link: www.TechForText.com/Sm/P.xltx ) There is a screenshot of the problem-solving template presented below:
To go to the first page of this
chapter left click on these words.
Below is the hyperlink table of contents of this chapter. If you left click on a section, or subsection, it will appear on your computer screen. Note the chapter heading, the yellow highlighted sections, and the blue subheadings are all active links.
To Access Additional Information with Hyperlinks
THE FOCUS AND PURPOSE OF THE SYSTEM PERSPECTIVE PRESENTED IN THIS E-BOOK
Diagrams for Cause-and-Effect Sequences, Energy, & Information Flow of Dynamic Systems
Using Similar Diagrams for: Cause-and-Effect, Energy, & Information Flow for Dynamic System
Dynamic Systems: a Template for Problem Solving
To go to the first page of this
chapter left click on these words
If you want to go to the next chapter
left click on the link below
For HTML:
www.TechForText.com/Sm/Chapter-6
For PDF
www.TechForText.com/Sm/Chapter-6/PDF.pdf
If you want to see a list of all
the chapters in this e-book go to