|
Techniques for Documenting with Proof or Supporting Evidence, and Related Strategies for Problem Solving By David Alderoty © 2016
Chapter 14) Technique 12) Using Schematic Diagrams, and Flowcharts
This e-book presents 28 techniques for supporting the validity of the statements you write. Left click on the above for a list of the techniques
This chapter contains a little over 3,900 words
If you want to go to chapter 13, left click on the following link:
www.TechForText.com/DP/chapter-13
To contact the author use David@TechForText.com or left click for a website communication form
Table of Contents, and an Outline of this Chapter The following is a hyperlink table of contents, as well as an outline of this chapter. If you left click on a blue underlined heading, the corresponding topic or subtopic will appear on your computer screen. Alternatively, you can scroll down to access the material listed in the table of contents, because this chapter is on one long webpage.
Topic 1.) Technique 12) Schematic Diagrams, and Flowcharts Subtopic, The Similarity Between Schematic Diagrams and Flowcharts Subtopic, The Utility of Schematic Diagrams Subtopic The Application of the Concepts Presented Above to Create Software with Microsoft Excel Subtopic The Application of Flowcharts for the Soft Sciences Subtopic, Using Schematic Diagrams And Flowcharts for Your Writing Subtopic, Schematic Diagrams and Writing Subtopic, Flowcharts and Writing Subtopic, The Difference in Utility Between Flowcharts and Schematic Diagrams for the writer Problem-Solving, and Goal Attainment, Assisted with Schematic Diagrams Or Flowcharts Topic 2.) Technique-12, Creating Schematic Diagrams, and Flowcharts Subtopic, Informal Schematic Diagrams Subtopic, Using Microsoft Word to Create Flowcharts and Informal Schematic Diagrams Subtopic, Using Microsoft Excel to Create Flowcharts and Informal Schematic Diagrams Additional and Supporting Information for This Chapter, from Web-Based Videos
This E-Book Provides Additional and Supporting Information from other Authors, with Web Links
This e-book contains links to web-based articles and videos from other authors, for additional, alternative, and supporting information. The links are the blue underlined words, presented throughout this e-book. However, some of these links are to access different sections of this e-book, or material on my own websites. Quotes and paraphrases in this e-book have hyperlinks to access the original source. The quotes are presented in brown text, which is the same color of these words. (The precise text color is RGB Decimal 165, 42, 42, or Hex #a52a2a) Some of the web links in this e-book will probably fail eventually, because websites may be removed from the web, or placed on a new URL. If a link fails, use the blue underlined words as a search phrase, with www.Google.com If the link is for a video, use www.google.com/videohp The search will usually bring up the original website, or one or more good alternatives. |
|
For those who prefer listening, as an alternative to reading, this book is recorded in an audio format.
For an audio narration of topic 1, left click on these words (requires 19 minutes, and 56 seconds).
For an audio narration of topic 2, left click on these words (requires 12 minutes, and 31 seconds).
|
|
Topic 1.) Technique 12) Schematic Diagrams, and Flowcharts ||| Technique-12, involves using diagrams that display a series of steps, and/or components connected together. The diagrams might show the flow of energy, data, fluid, traffic, electricity, gas, water, air, or money, through the connections. Technique 12 is used in many fields. When people plan a long driving trip with a roadmap, involving designated stops for eating, gas stations, and sleep, they are essentially using a simplified version of this technique. Both schematic diagrams and flowcharts are illustrations that generally involve specific steps or components that are represented by symbols, sketches, or pictures, with lines or arrows connecting them. The symbols can sometimes be words encased in geometric figures. The symbols may represent specific occurrences, or tasks. However, the symbols often represent specific entities, especially in schematic diagrams, such as electronic components, mechanical devices, organs, cellular structures, etc. The arrows or lines connecting the components can represent wires, pipes, arteries, veins, roadways, the flow of time, or hypothetical or virtual pathways. Left click on the following links for web-based examples of schematic diagrams and flowcharts:
· Schematic diagram of a crystal radio The source is Making and using crystal radios, Posted by pifflelab
· Schematic diagrams of crystal radios, from Google Images
· Auxiliary Aircraft Systems Hydraulic system Schematic
· Schematic diagram of hydraulic systems, Google images
· Simple Flowchart water cycle
· Flowchart of Water cycle, from Google images
· Carbon Dioxide Cycle Flowchart The source is Government of Australia, obtained from Kable, a trading division of Kable Intelligence Limited
· Carbon Dioxide Cycle Flowcharts from Google Images
Subtopic, The Similarity Between Schematic Diagrams and Flowcharts ||| Schematic diagrams and flowcharts are illustrations that are more or less similar to each other. Sometimes these terms are used almost interchangeably, and it is sometimes difficult to decide what should be called a schematic diagram, and what should be classified as a flowchart. This is especially the case in biology, which can be seen from the following web-based examples:
· Flowcharts for the endocrine system, from Google Images
· Schematic diagrams for the endocrine system, from Google Images
· Flowcharts for photosynthesis, from Google Images
· Schematic diagrams for photosynthesis, from Google Images
· Flowcharts of changes in the Earth’s crust, from Google Images
· Schematic diagrams of changes in the Earth’s crust, from Google Images
The idea to keep in mind is it is not important how a diagram is classified, but it is very important to be certain that the diagram is serving the required function optimally. Usually the required function falls roughly into two categories, which is how to build something, or an explanation of how an entity functions. This is explained in the following two paragraphs: When the function of the diagram is to illustrate how to build something, such as an electronic circuit, the diagram must be very precise. The diagram, or attached fact sheet, must contain all relevant parameters of the components. This is because the components must be purchased to build the device. When a diagram fits the above criteria, I classify it as a schematic diagram. Diagrams are very often used to explain cause-and-effect sequences, and/or dynamics and mechanics of natural entities, or devices created by humans. When the diagram is used to explain a general concept, or how a device functions, the parameters mentioned in the previous paragraph might be irrelevant, and possibly an unnecessary distraction. Diagrams in this category are usually less precise than the diagrams described in the previous paragraph. I classify diagrams that fit the above criteria as flowcharts.
Subtopic, The Utility of Schematic Diagrams ||| Schematic diagrams are often used in engineering and electronics. Schematic diagrams are often used to represent the precise *components and connections that are required to build a system, subsystem, mechanical device, or an electronic circuit. *Note, sometimes a black box is used to represent a set of components that comprise a subsystem. For example, if an electronic circuit contains an amplifier, instead of creating a schematic diagram of the hundreds of components that comprise an amplifier, a single box might be used to represent that amplifier. When this is done, the separate schematic diagram might be created to provide the details needed to build the device represented by the black box. Sometime black boxes represent components that are not fully understood, especially in biology. This often involves an understanding of the input and an understanding of the output of a component, but little or no understanding of how the input was converted to the output. Presented below there are a number of examples of schematic diagrams that relate to specific fields:
● Plumbing Schematics The source is can be access from this link: Plumbing Schematics, External Pressure Pump
● Schematic diagrams for plumbing from Google Images
● Simple Hobby Electronic Circuits Homemade Circuit Projects
● Schematic diagrams for electronic circuits from Google Images
● Samples / Universal Diagramming / Education — Medicine
● Schematic diagrams for Endocrine System from Google Images
● Schematic diagrams for sex hormones from Google Images
● Schematic diagrams for Endocrine System from Google Images
● Schematic diagrams for blood circulation, from Google Images
● Schematic diagrams for photosynthesis from Google Images
● Schematic diagrams for ADP and ATP from Google Images
● Schematic diagrams for meteorology from Google Images
● Schematic diagrams for lymphatic circulation, from Google Images
● Schematic diagrams of the proposed molecular mechanism for osteoporosis due to osteoblast function loss. This diagram was obtained from a ResearchGate page. The original article is accessible from this link: Core level regulatory network of osteoblast as molecular mechanism for osteoporosis and treatment Ruoshi Yuan
Subtopic, Schematic Diagrams, and Flowcharts, Often Involve Cause-and-Effect Sequences, which May be Exergonic, or Endergonic ||| Schematic diagrams, and flowcharts, usually depict entities that involve one or more cause-and-effect sequences. This often involves a set of steps or actions that take place sequentially. However, they can also involve steps that take place simultaneously, especially if the diagram involves a complex system. The diagrams depict the flow of energy, data, fluid, and/or other entity from one component to another. As explained in Chapter 13, there are two general categories of cause-and-effect sequences, which I am calling exergonic, and endergonic. These are terms that I borrowed from chemistry, which relate to the output or input of energy of a reaction. This is explained in the following two paragraphs. Exergonic cause-and-effect sequences do not require a continuous input of energy, and they release energy into the environment. However, these sequences may require a small amount of energy to initiate the reaction. Two examples are forest fires, and the energy produced by nuclear reactors. Endergonic cause-and-effect sequences require a continuous input of energy to take place. The cause-and-effect sequences that take place in internal combustion engines and it electronic devices are endergonic. Most schematic diagrams and flowcharts depict systems that involve one or more endergonic cause-and-effect sequences. Presented below there are web links to schematic diagrams and flowcharts that represent exergonic and endergonic systems.
· The Hydrogen Bomb: Schematic Exergonic (releases energy)
· Nuclear Flowcharts Exergonic (releases energy)
· PHOTOSYNTHESIS FLOW CHART Endergonic (requires energy) · · Endocrine System Flow Chart Endergonic (requires energy)
· The Simplest Amplifier Circuit Diagram Endergonic (requires energy)
· Single transistor radio Endergonic (requires energy)
Subtopic The Application of the Concepts Presented Above to Create Software with Microsoft Excel ||| I used the concepts presented in this topic to create online software with Microsoft Excel, and SpreadsheetConverter. This essentially involves schematic diagrams that depict the flow of data from one formula to another. The flow of data and the processing of the data by each formula is an endergonic cause-and-effect sequence. In the following paragraph, I explain an example of this type of software. About five years ago, (2012) I created a very complex software device for demonstrational and experimental purposes. This device involves a number of endergonic cause-and-effect sequences. The sequences take place automatically when one of the update buttons on the software is clicked with the mouse. This software is comprised of a semi-random number generator that uses the computer’s clock and the number of formulas to generate random numbers. The random numbers are automatically fed into 10 calculation devices, which carry out over 60 calculations simultaneously, involving algebra, calculus, hyperbolic functions, trigonometry, and geometric calculations for a circle and rectangle. This software has a schematic diagram displayed on its surface, which consists of formulas and lines depicting the flow of data from one formula to another. This software is about 21 pages in length. You can access the online version of the software from the following links:
· If you want detailed information about this software left click on the following link: www.TechForText.com/Multiple-Calculation-Software-with-A-Semi-Random-Number-Generator-Based-On-Time
· (Note, the above webpage does not display optimally in Internet Explorer. Ideally, you should use Chrome, Firefox, or Opera. If you want to download any of the above browsers, click on the bold blue underlined words.
Subtopic The Application of Flowcharts for the Soft Sciences ||| Flowcharts can be useful for the soft sciences, such as history, sociology, and psychology. A good example of application of flowcharts to history is apparent from the following quote obtained from Chris Butler at www.flowofhistory.com: “As a history teacher at University High School in Urbana, Illinois since 1979, I have developed a method for teaching history, using a series of about 200 cross-referenced flowcharts and over 100 PowerPoint multimedia lecture outlines to help students see history as a dynamic process of causes and effects, not just a meaningless list of names and dates.”
Additional examples of the application of flowcharts to the soft sciences can be seen by clicking on the following links:
· Cycles of Conflict: A Computational Modeling Alternative to Collins’s Theory of Conflict Escalation
· The Road to World War II (1919-39)
· Biological, Cultural, and Technological Evolution in History
· The Israelites (c.2000-500 BCE)
· Google images: Flowcharts for psychology
· Google images: Flowcharts for Sociology
Subtopic, Using Schematic Diagrams And Flowcharts for Your Writing ||| Schematic diagrams and flowcharts can be very useful to reinforce your writing. This can involve creating schematic diagrams and flowcharts to support your arguments and explanations. This is especially the case, if you are dealing with science, engineering, electronics, business, or any material that involves cause-and-effect sequences. The development of a problem and its solution can sometimes be explained with flowcharts. The steps to obtain a solution or long-term goal can be illustrated with flowcharts, which can include the estimated time interval and cost to complete each step.
Subtopic, Schematic Diagrams and Writing ||| Schematic diagrams are very useful when writing about technical or scientific material. This is especially the case when the material you are writing about involves electronics, fluid flow, or data transmission through a complex network. If your readers have appropriate training, a single schematic diagram, can clearly illustrate a very complex set of ideas. This can involve how to build an electronic circuit, or any device that involves fluid flow.
Subtopic, Flowcharts and Writing ||| If you are writing general articles, flowcharts are probably more useful than schematic diagrams. It is easy to create flowcharts to illustrate specific ideas. The complexity of flowcharts can be adjusted to meet the needs of the readers. Flowcharts usually do not involve a precise set of components the way schematic diagrams do. Flowcharts are widely used as illustrations, in business, in articles for the general reader, and sometimes in scientific textbooks. Flowcharts can be used to represent workflow on an assembly line, which may include estimates of the required time to complete specific tasks. Flowcharts are sometimes used to illustrate hypothetical concepts, plans, goals, and the causes and solutions to problems. Flowcharts may be used to illustrate ideas or concepts without scientific certainty or mathematical precision. Often the ideas presented by flowcharts are possibilities as opposed to certainties, especially when they are used in business, to predict future profits.
Subtopic, The Difference in Utility Between Flowcharts and Schematic Diagrams for the writer ||| Flowcharts and schematic diagrams have a somewhat different utility from the perspective of the writer. This is explained with the following two examples. If you are explaining how an oil well drilling platform works, you should use a flowchart. This should include all the components that are necessary to explain how the device functions. On the other hand, if you are writing instructions on how to build or assemble an oil well drilling platform, you should use a schematic diagram. This diagram should include every component that is necessary to build the device, including the parameters of each component.
Problem-Solving, and Goal Attainment, Assisted with Schematic Diagrams Or Flowcharts ||| Schematic diagrams and flowcharts are useful for certain types of problem solving, and goal attainment efforts. Problems can sometimes involve multiple factors, and complex dynamics. Problems in this category can be represented in flowcharts, in terms of cause-and-effect sequences and/or contributing factors. This can sometimes reveal solutions, and it might reveal strategies to prevent the recurrence of the problem. Flowcharts are best for non-technical problems, and schematic diagrams are best for technical problems, such as a failure of an electronic circuit. Complex goals can be outlined with flowcharts or schematic diagrams. This is especially useful when the goal is complex, or when a series of precise steps must be carried out in sequence to obtain an objective. For non-technical goals, including personal objectives, flowcharts are likely to be useful. For technical goals, such as building an electronic circuit, schematic diagrams should be used. Flowcharts can be used to evaluate how individuals, corporations, succeeded and failed in goal attainment. This may reveal successful strategies for obtaining specific goals, as well as strategies to avoid. It can also reveal the sequences of steps and roadblocks that frequently lead to fortunate and unfortunate life situations, such as wealth, poverty, academic success, school failure, health, and illness. If you want to obtain a major goal, talk to people that obtained similar goals. With this information, create flowcharts that depict the strategies they used to obtain the goal. The flowcharts should include the problems they faced, and the solutions they used. This is especially useful for career goals.
||| Problem Solving Methodology Wizard Flow Chart, Flow chart for the Problem Solving Methodology Wizard
YouTube search pages Problem solving and flowcharts
Video: Problem Solving Techniques #8: Flow Charts, Eugene O'Loughlin
Video: Problem Solving: Pseudocode and Flowchart, Heidi Gentry-Kolen
Video: Problem Solving: Pseudocode and Flowchart Sequential Logic, by Heidi Gentry-Kolen
Video: Equations Solving with Flowcharts, by Carolyn Nickelo
Video: Problem Solving Techniques #1: Pareto Analysis
Google images: Problem analysis with flowcharts
Google images: Problem Solving with flowcharts
Google images: Schematic diagrams to solve problems
Google images: Flowcharts showing successful strategies
|
|
Topic 2.) Technique-12, Creating Schematic Diagrams, and Flowcharts ||| There are a number of ways of creating schematic diagrams and flowcharts. The most obvious is with paper and pencil. A pen can be use of course, but a pencil is a better choice, because you can easily erase errors. Diagrams of this nature can be scanned into a word processor document. If you plan to do this, it is usually best to create a large diagram, and shrink it to the size you want, with the functions in the word-processing software. A number of software programs can be used to create schematic diagrams and/or flowcharts. This includes Microsoft Word, and Microsoft Excel. Some of these software devices are specifically designed for this purpose. The following are web links to access information and software for creating schematic diagrams and flowcharts:
· Google search pages: Software for creating schematic diagrams
· TinyCAD, for creating schematic diagrams of electronic circuits
· Electronics circuit drawing software
· Schematics Maker - Create Schematic Diagrams Easily
· Circuit Diagram, Design and share diagrams using a wide range of components.
· Google search pages: Software to create Flowcharts
· Google search pages: Creating flowcharts with Microsoft Word
· Productivity, Windows How to Create Stunning Flowcharts With Microsoft Word
· Video: Creating a Simple Flowchart in Microsoft Word, Floyd Jay Winters
· Video: Word Microsoft How to create a flowchart, mind map, web, learning map, etc.
· Google search pages: Creating flowcharts with Microsoft Excel
· Flowcharting in Excel Series How to Create a Flowchart in Excel · How To Make A Flowchart In Excel
· Make Great-looking Flowcharts in Excel · FlowBreeze - Flowchart Automation Add-in For Excel
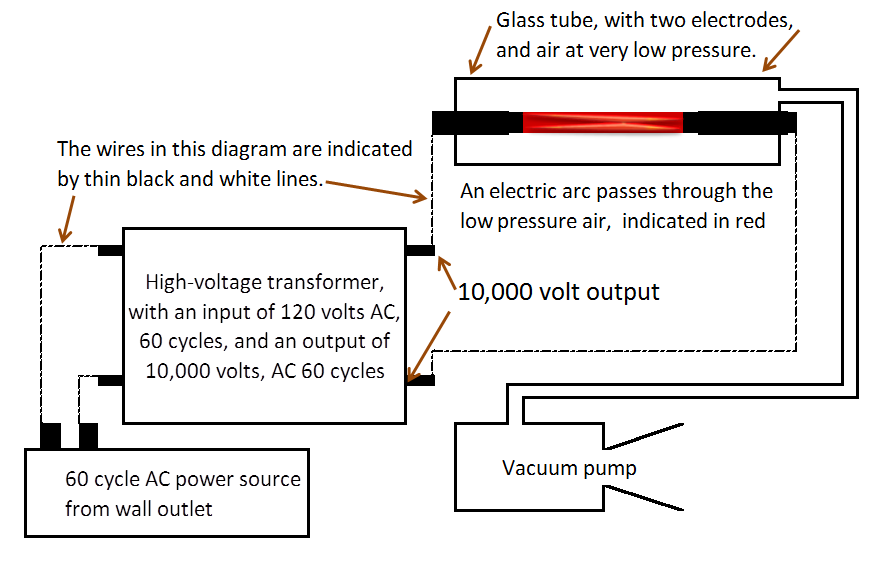
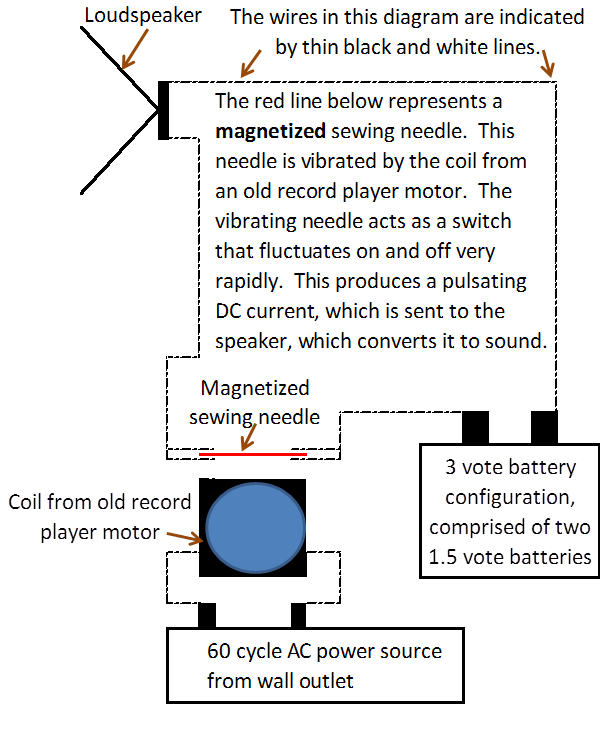
Subtopic, Informal Schematic Diagrams ||| Generally, schematic diagrams are created with specific set of symbols that relate to a specific discipline, such as electronics, or hydraulics. This usually requires time, effort, and training to learn symbols. However, schematic diagrams can be created in an informal style using simple sketches, and or geometric figures, with descriptive labels. Carefully labeling of components is especially important, because you are not using standard symbols that can be universally identified by your readers. Presented below there are two examples of informal schematic diagrams that I created using functions and Microsoft Excel. I copied and pasted the diagrams from Excel to a Microsoft Word document. I pasted the diagrams in a format that Microsoft calls Picture (Enhanced Metafile). This produced better results than the other alternatives.
AN ELECTRIC ARC ||| This device produces an electric arc in a glass tube. As a teenager, I carried out a number of experiments with an apparatus similar To this device.
You can download the above diagram in the Excel format, by left clicking on these words.
ELECTRONIC NOISEMAKER ||| This device is essentially an electronic noisemaker, and I created it when I was about 10 years old. This device uses both 120 V AC 60 cycle current, and a battery for a DC power source, which obviously is not an example of optimum engineering.
You can download the above diagram in the Excel format, by left clicking on these words.
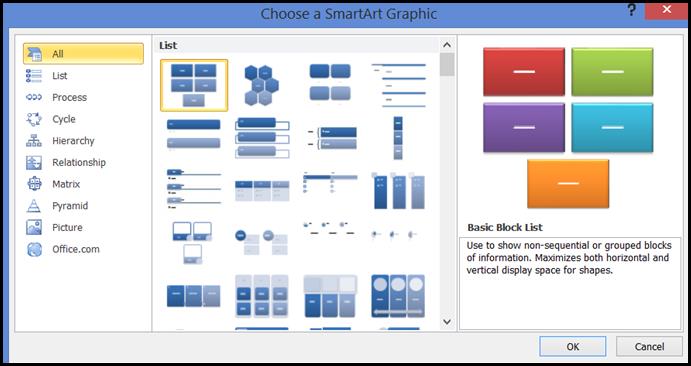
Subtopic, Using Microsoft Word to Create Flowcharts and Informal Schematic Diagrams ||| The smart art menu in Microsoft Word is especially useful for creating flowcharts and informal schematic diagrams. It is relatively easy to use.
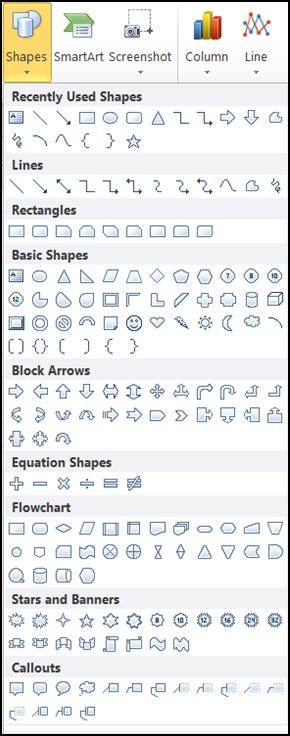
The following is an insert from the smart art function in Microsoft Word.
The menu labeled shapes, in Microsoft Word provides the functionality needed to draw any shape freehand, or inserting specific geometric figures, lines, and arrows. This is a very versatile drawing tool.
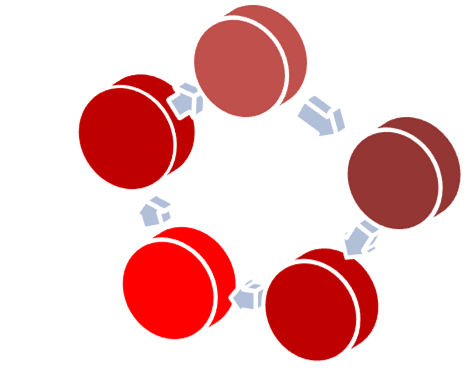
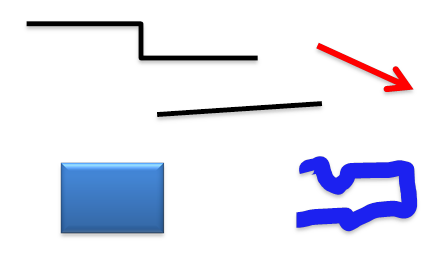
The following are some examples of lines, curves, arrows, and geometric figures that can be created with shapes function in Microsoft Word.
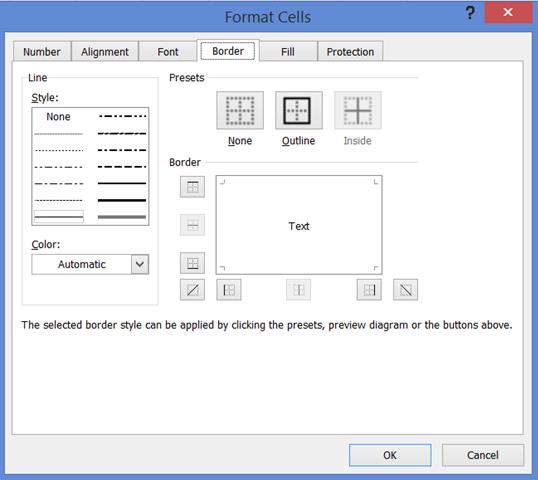
How to use Microsoft Excel’s border function to create flowcharts
Subtopic, Using Microsoft Excel to Create Flowcharts and Informal Schematic Diagrams ||| Microsoft Excel has the same drawing functions as Microsoft Word. These functions were described above. In addition, Excel has a function to create borders around the cells, which is very useful for drawing diagrams that contain squares, rectangles, and lines.
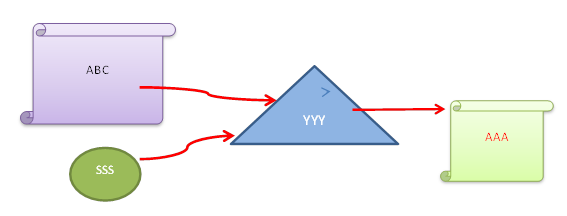
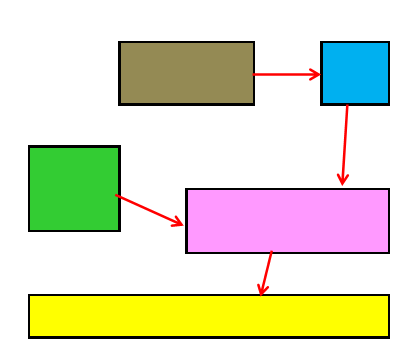
The following was created with Microsoft Excel’s border function. The arrows were inserted from the menu labeled shapes.
||| Microsoft Excel is obviously spreadsheet software that can be programmed by the user to carry out almost any type of mathematical calculation. As explained above, Excel also has functions that can be used to create flowcharts, and informal schematic diagrams. This can be combined with Excel’s mathematical functionality to create flowcharts and schematic diagrams with calculation devices. This allows users to enter their own numbers and obtain calculated results. To demonstrate this, I created two diagrams with built-in calculation mechanisms with Microsoft Excel. One of these diagrams is a flowchart, and the other is a schematic diagram. I converted both of these devices from the Excel format to JavaScript, so they will function online. (Note, I did not use the shapes and smart art functions in Microsoft Excel for the above. This is because the JavaScript conversion software I was using failed to produce satisfactory conversions went these functions were used.) The flowchart is very simple, and it illustrates the flow of time and the sales of a product, and the resulting profit. It also shows the flow of data from one input box to another, and to a yellow display box that shows the calculated results. However, the calculation mechanism in this device is relatively complex. It calculates the profitability of a product, based on previous sales, in terms of rate of return. This includes the yearly, monthly, weekly, and daily rate of return, displayed in percent.
For the online JavaScript version of the flowchart left click on the following link: www.TechForText.com/DP/chapter-14/FW
You can download the flowchart in the Excel format, by click on the following link: www.techfortext.com/DP/Chapter-14/ProfitabilityCalc.xlsx
If you want to study the structure of the calculation mechanism, and related formulas, download this Excel worksheet, by left clicking on the following: www.techfortext.com/DP/Chapter-14/ToStudySoftware.xlsx
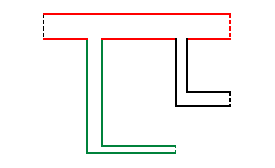
The schematic diagram I created with Microsoft Excel is an informal schematic diagram of a transformer and its power supply. The software calculates the output voltage, amperage, and wattage of the transformer, based on the numbers entered by the user.
For the online JavaScript version of the schematic diagram left click on the following link: www.TechForText.com/DP/chapter-14/SD
To download the schematic diagram in the Excel format click on the following link www.techfortext.com/DP/Chapter-14/S-DiagramAndCalc.xlsx
To study the structure of the calculation mechanism, and related formulas, download the following Excel worksheet, by left clicking on the link below. www.TechForText.com/DP/Chapter-14/ToStudyS-DiagramCalc.xlsx
||| Flow Charts, Identify and Communicate Your Optimal Process
Diagram Designer Lets you Create Flowcharts and Network Diagrams from Windows
Create Pie charts – Bar Graphs – Venn Diagrams Online with Free tools
How to Draw an Effective Flowchart
World's Largest Selection of Electronic Components Available for Immediate Shipment! URL for the above is www.digikey.com
Free Flowchart Software and Tools, Freeware
10 Best Free Flowchart Software For Windows
Scheme-it -- Free Online Schematic Tool | DigiKey
Basic Electronic Components and their Symbols and Connections, Edgefx Kits
The Top 5 Reasons To Use Flowcharts, By Nicholas Hebb
Lessons In Electric Circuits -- Volume IV
How to Read a Schematic, electronics
The schematic diagram for traffic flow on two-lane highway
KiCad EDA A Cross Platform and Open Source Electronics Design Automation Suite The URL for the above is http://kicad-pcb.org
Additional and Supporting Information for This Chapter, from Web-Based Videos ||| YouTube search page: Using flowcharts in your writing
Algorithm using Flowchart and Pseudo code Level 1 Flowchart, by Yusuf Shakeel
Programming Basics: Creating an algorithm/flowchart and then adding a counter, by Mandy Orzechowski
Creating a Simple Flowchart in Microsoft Word, by Floyd Jay Winters
Problem Solving Techniques #8: Flow Charts
Scheme-it -- Free Online Schematic Tool | DigiKey
How to trace hydraulic circuit in fluid power !!!
EEVblog #253 - KiCAD Install & Schematic - First Impressions
If you want to go to chapter 15 of this e-book, left click on the following link:
www.TechForText.com/DP/chapter-15
|